Biosignal Challenge 2024
sleep apnea detection
General Information
The disease not only leads to the cessation of oxygen supply and consequently a decrease in blood oxygen saturation but also to a significant decline in sleep quality and overall patient health. Patients often wake up feeling tired, even after a full night’s sleep.
There are two basic types of apneas. Some patients suffer from a combination of both types.
- Obstructive Sleep Apnea
- Anatomical causes, resulting from the mechanical closure of the airways (pharynx) during sleep.
- Central Sleep Apnea
- Cause in the central nervous system, the airways are intact, but the breathing effort is lacking, the brain is not giving the correct signal to the respiratory system.
- Complex Sleep Apnea
- It begins as central (lack of respiratory effort) apnea but transitions into obstructive apnea (respiratory effort is restored during the episode).
Common symptoms include loud snoring, sudden awakening with shortness of breath, excessive daytime sleepiness, or difficulties with attention and irritability.
The Biosignal Challenge 2024 aims to develop an algorithm for detecting sleep apnea using modern computational resources and annotated signals of airflow, oxygenation, and ECG. A robustly designed and reliably functioning algorithm would significantly accelerate the work of physicians who currently have to manually review multi-hour recordings and manually annotate apneic episodes.
Annotated Sleep Apnea Database (NIMH)
The data are sourced from an annotated database of several-hour recordings of patients from the National Institute of Mental Health, Topolová 748, 250 67 Klecany. The data were recorded for scientific purposes with informed consent from the patients. Patients were divided into 5 groups based on the number of apneic episodes:
- minimum number of apneic episodes (<q25)
- low number of apneic episodes (q25 – q0.5)
- medium number of apneic episodes (q5 – q0.75)
- high number of apneic episodes (>q75)
Approximately 2/3 of all available recordings were included in the training dataset and the remaining 1/3 in the test dataset. Both groups contain a similar proportion of recordings from each category, making the training dataset proportionally representative of the test dataset. For each subject, three signals are available: the second lead of ECG (ECG), airflow (flow), and blood oxygenation (SpO2).
The data come from a clinical environment and are not processed in any way. It is necessary to take into account that the data are noisy and also contain a significant amount of artifacts. These artifacts include motion artifacts, where the subject moves in bed, as well as technical artifacts, where there is a momentary disconnection of the sensor or interruption of the signal due to the subject going to the restroom. Therefore, a suitable solution must also include appropriate data filtering and artifact recognition.
The training dataset contains 290 recordings of apneic patients (labeled as ap_xxx.mat) and the test dataset contains 148 recordings of apneic patients.

Figure 1: Histogram of the number of apneas (per hour) of each patient in the training and test datasets.
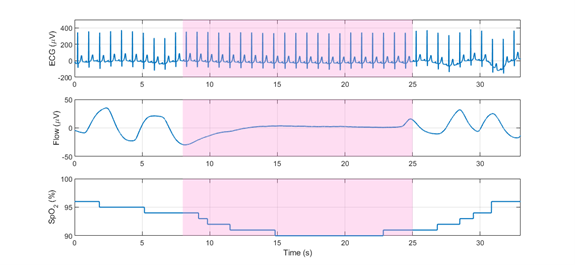
Figure 2: Annotated apneic episode on ECG (top), flow (middle) and SpO2 (bottom) signals.
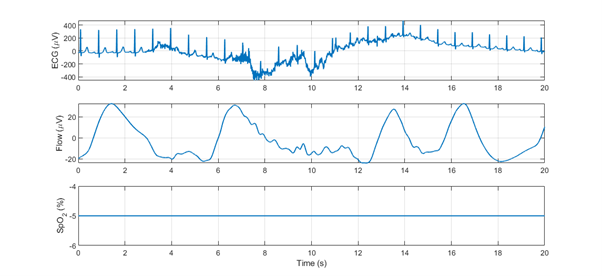
Figure 3: Motion artifact on ECG signal (top), flow signal (middle), and SpO2 signal (bottom). The oxygenation sensor is disconnected during this time interval (negative value of the SpO2 signal).
Detection methods
Participants can utilize advanced signal processing methods, machine learning, and artificial intelligence in the MATLAB programming environment. However, the use of pre-trained models is not allowed. Neural networks must be designed from scratch – downloading pre-trained weights is not permitted. Participants can use the provided data for algorithm training, as well as any public databases with physiological signals (e.g., https://physionet.org/about/database/).
When using advanced machine learning techniques, it is important to note that the dataset is highly unbalanced. Segments containing no apneic events significantly outnumber segments that capture an apneic event.
Evaluation criteria
The performance of algorithms is determined by a set of parameters derived from comparing expert evaluation with detection results. Although expert evaluation is considered as the reference, infallibility in labeling apneic episodes cannot be expected. Due to the length of recordings or the subjective perspective of the evaluator, occasional inaccurate labeling of apneic episodes can be expected. Therefore, we do not expect identical results from algorithms, but their performances should closely approximate the reference.
The algorithms will be evaluated based on the robustness and accuracy of detection on the test dataset. Three groups of detections will be crucial for the final evaluation.
- TP (true positive) – correctly detected sample from an apneic episode
- FP (false positive) – incorrectly detected sample outside of an apneic episode
- FN (false negative) – undetected sample from an apneic episode
Algorithm’s performance will be evaluated based on the following metrics:
1. Area Under Precision-Recall curve on the test dataset (40 %)
For each threshold (each probability value at the output of the classifier), precision and recall metrics will be calculated. The area under the resulting Precision-Recall curve will then be taken as the first evaluation criterion.

Precision and recall definition.
2. F1-score on the test dataset (40 %)
For each threshold, the F1-score will be calculated according to the following formula:

F1-score definition.
The final value will be taken as the maximum of all F1-score values across different thresholds used to create the P-R curve.
3. Area Under Precision-Recall curve on the training dataset (5%)
4. F1-score on the training dataset (5%)
5. Difference between performance on training and test datasets (10 %)
To verify the robustness of the algorithms, the performance of the algorithm on the training and testing datasets will be compared according to the following formula:

Metrics definition for algorithm performance comparison on the training and testing datasets.
Competition Conditions
- The competition is open to university students in the Czech Republic.
- Solution teams can consist of 1 to 3 members.
- All algorithms must be implemented in the MATLAB environment.
- Each team must register at https://bsch.fel.cvut.cz by March 20.
- Solutions must be submitted at https://bsch.fel.cvut.cz by May 17, 2024.
- The solution must include:
- Main function: apnoe_detekce.m
- All additional files and data necessary to run the main function.
- A report in PDF format containing the team name, university, number of team members, MATLAB version used, description of the methods used, results on the training database, and a list of references used.
Data access
One team member must register at https://bsch.fel.cvut.cz. After registration, it is necessary to log in at the same address and submit completed forms from all team members. Then the team’s registration will be approved, and access to the data will be granted.
Submitted Algorithm
The submitted algorithm must include the main function apnoe_detekce.m and all other functions upon which the main function relies. If you will be training advanced artificial intelligence algorithms that depend on learned weights, also include training scripts.
Input
Files from the training and test dataset have the format of a structure file.xxx, where xxx represents the following fields:
- filename …. File name
- ecg …. ECG signal, size: [number of samples, 1]
- flow …. Airflow signal, size: [number of samples, 1]
- spo2 …. Oxygenation signal, size: [number of samples, 1]
- gt_segments … Indices of intervals (in samples) containing apneas – format: [start of apnea, end of apnea], size: [number of apneas, 2]
- not present in the test dataset
- fs … sampling frequency (250 Hz)
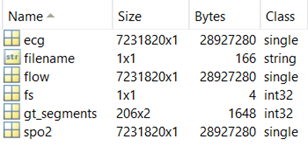
Figure 4: Data structure of the apnoe_detekce.m input.
Output
The output of the function apnoe_detekce.m should be a structure with detections for individual files. The detections have a format of a nested structure DET.detection.xxx, where xxx represents the following fields:
- filename … file name
- score … output of the classifier containing the probability (0-1) that a given sample will be classified as an apnea, size [number of samples, 1]
References
- Baguet, J.-P., Barone-Rochette, G., Tamisier, R., Levy, P., & Pepin, J.-L. (2012). Mechanisms of cardiac dysfunction in obstructive sleep apnea. Nature Reviews Cardiology, 9(12), 679.
- Hassan, A. R., & Haque, M. A. (2016). Computer-aided obstructive sleep apnea screening from single-lead electrocardiogram using statistical and spectral features and bootstrap aggregating. Biocybernetics and Biomedical Engineering, 36(1), 256–266.
- Jin, J., & Sanchez-Sinencio, E. (2015). A home sleep apnea screening device with time-domain signal processing and autonomous scoring capability. IEEE transactions on biomedical circuits and systems, 9(1), 96-104.
- Bartoň, M. (2020). Event detection in polysomnographic recordings by using machine learning techniques. Kladno. Master’s thesis. Faculty od Biomedical Engineering CTU.
Prizes for the winners
- 1st place: 15.000 CZK
- 2nd place: 9.000 CZK
- 3rd place: 6.000 CZK
Partners and sponsors
